Introduction
When it comes to investing in stocks, understanding key financial metrics can make the difference between making a wise investment and throwing your money into a pit. If you have been in the stock market for some time, you have most likely heard about PE and PEG ratios. Investors use these two ratios as the most common financial metrics to evaluate companies. Think of these ratios as the compass and map for your investment journey — each provides unique insights, but using them together can help you navigate the market more effectively.
What is the PE Ratio?
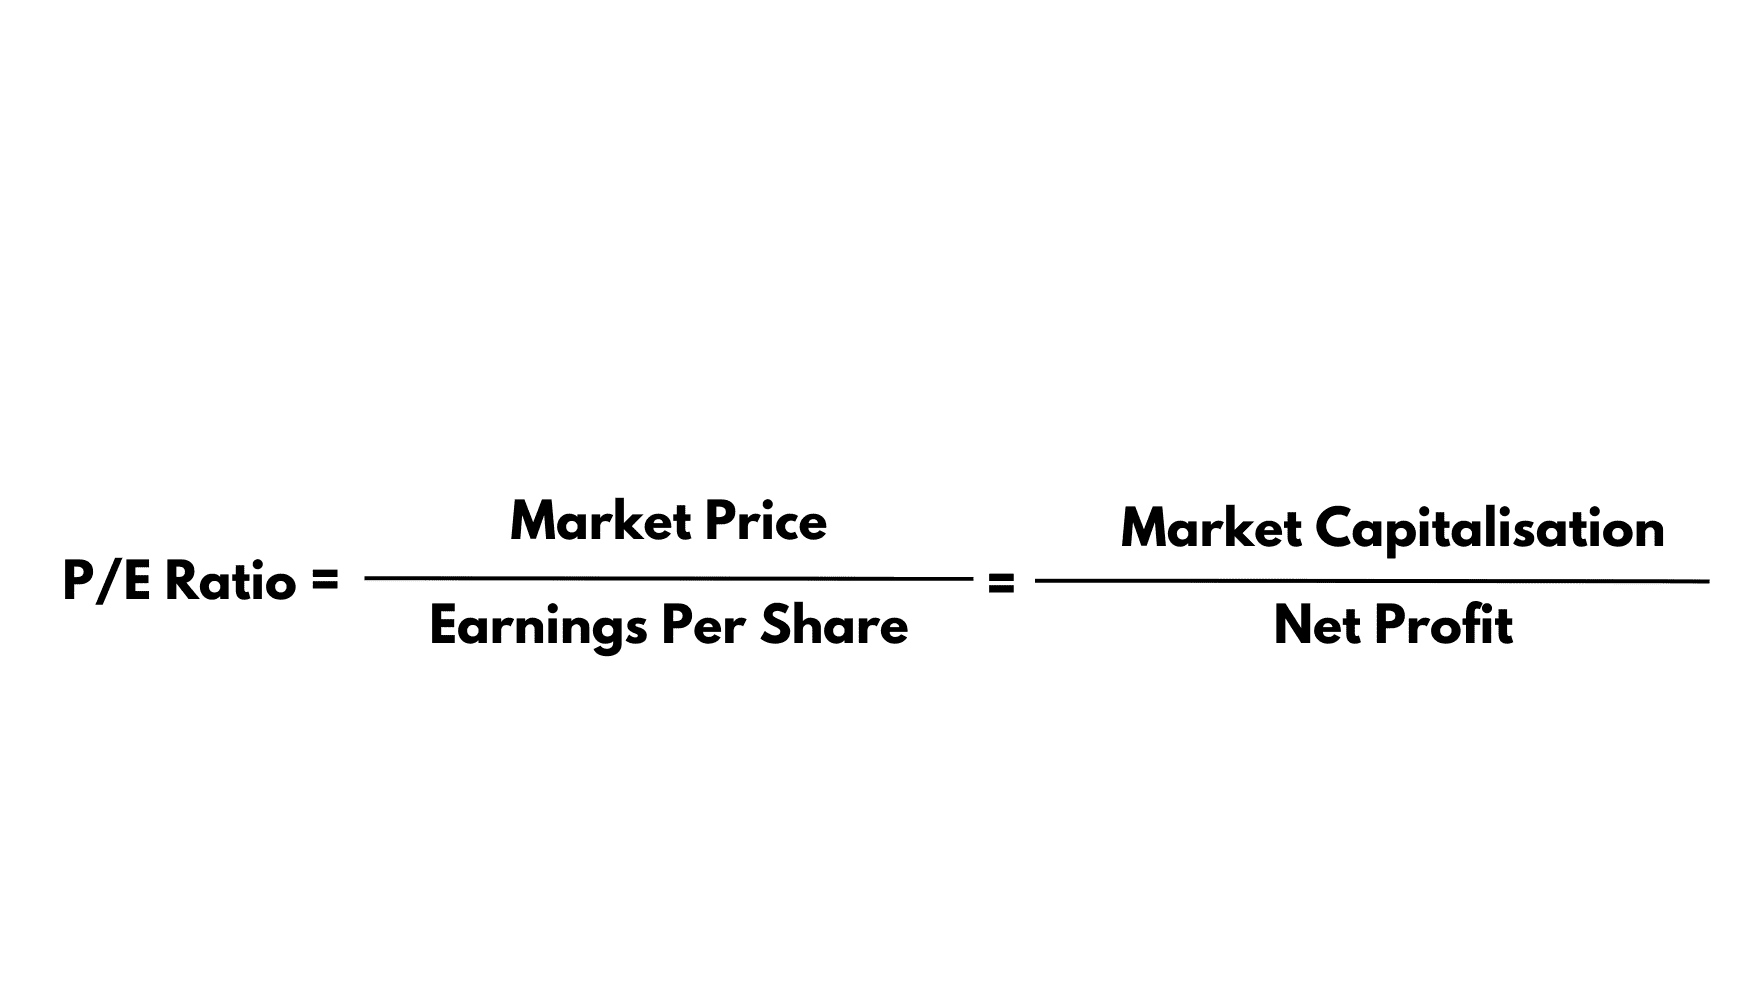
The PE (Price-to-Earnings) ratio is one of the simplest tools used to evaluate the value of a company’s stock. You calculate it by simply dividing the current market price (CMP) of the stock by its earnings per share (EPS). In essence, it tells you how much investors are willing to pay today for a rupee of the company’s earnings. The simplicity of the tool makes it very popular among investors.
PE Ratio Formula:

PE Ratio Example

Types of PE:
- Trailing PE Ratio: This uses the earnings from the past (trailing) 12 months to calculate the company’s PE. It provides a realistic and impartial snapshot of a company’s recent performance.
- Forward PE Ratio: This estimates the earnings for the upcoming 12 months. It helps predict how the company might perform in the near future and gauges its growth potential. Since we are talking about the future, forward PE has a high degree of uncertainty associated with it.
The PE ratio alone isn’t very informative. Comparing it to the industry average PE, makes it meaningful and helps determine whether a company is overvalued or undervalued. The ideal PE ratio varies depending on the company and its industry.
Did you know that you can calculate the Nifty’s PE Ratio by dividing the Nifty’s total market cap by the combined earnings of its constituent companies?
What is the PEG Ratio?
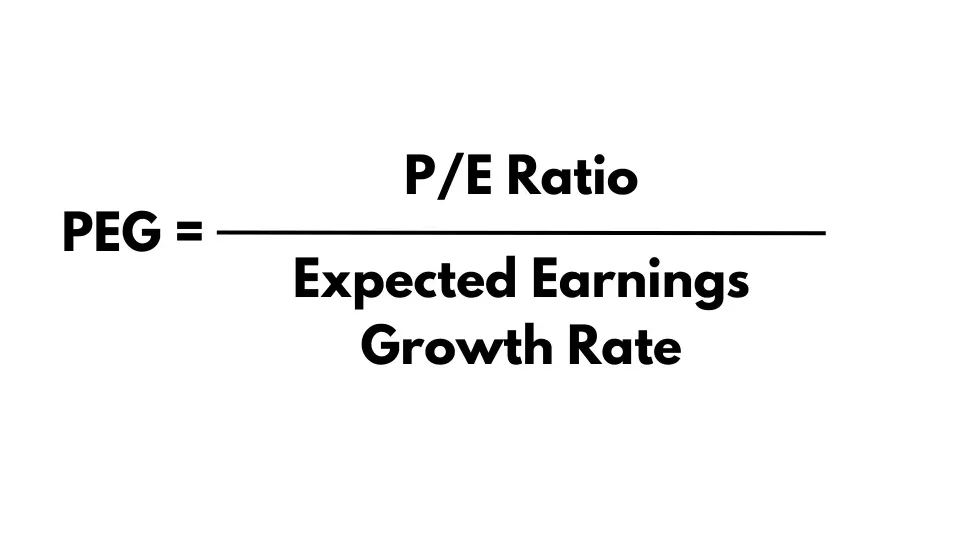
The PEG ratio expands on the PE ratio by factoring in the company’s expected earnings growth. You can calculate it by simply dividing the PE ratio by the annual earnings growth rate. This adjustment makes the PEG ratio a more comprehensive tool because it considers future earnings growth, not just current earnings.
PEG Ratio Formula:

How to Determine the Growth Rate in PEG?
- Bearish Scenario: Assume the company achieves only 50% of its future growth projection.
- Neutral Scenario: Use the average growth rate of the last 3-5 years.
- Bullish Scenario: Consider the average growth rate of the last 3 years and include internal factors like capital expenditure (capex), acquisitions, management guidance and external factors like favorable government policies, market sentiments, industry trends, etc. It’s easy to become overly optimistic in this scenario, so it’s crucial to remain cautious, conservative and realistic, taking everything with a grain of salt.
Comparing PE and PEG Ratios
Simplicity vs. Expectations
The PE ratio is very easy to understand. It gives you a quick snapshot of a stock’s valuation. However, it lacks context regarding the future growth of a company. The PEG ratio, on the other hand, incorporates future growth expectations, providing a more nuanced picture.
The PE ratio is like judging a car solely by its current speed, while the PEG ratio considers how quickly it can accelerate. A car that’s currently slow but can accelerate quickly might be more valuable in a race.

Basing investment decisions solely on PE is not a wise investment decision. A low PE ratio might suggest low future expectations or a value buying opportunity, while a high PE ratio could indicate strong future expectations, overvaluation based on the company’s earnings, or a high growth potential.
To make a well-informed investment decision, it’s essential to consider the PE ratio alongside the PEG ratio and other financial metrics.
Valuation Insights
A low PE might indicate that a stock is undervalued, but it could also suggest underlying problems within the company. Conversely, a high PE could mean a stock is overvalued, or it might reflect high investor confidence in the company’s growth prospects.
The PEG ratio can help clarify these scenarios. For instance, a stock with a high PE might still be a good investment if it also has a high growth rate, resulting in a PEG close to 1.
Generally, a PEG below 1 suggests a stock may be undervalued relative to its growth rate, while a PEG above 1 might indicate overvaluation. A PEG of 1 indicates that the company is at a fair valuation, which seldom happens in the market.
When to Use PE and PEG Ratios
PE Ratio: The Quick Glance
Use the PE ratio when you want a quick, general sense of a company’s valuation. It’s particularly useful when comparing companies within the same industry.
PEG Ratio: The Deeper Dive
The PEG ratio is more useful for growth-oriented investors. It helps assess whether a stock’s price is justified by its future earnings potential. This makes it invaluable for evaluating new-age companies or startups where high growth rates are expected.
Conclusion
Understanding and utilizing both the PE and PEG ratios can significantly enhance your investment strategy. The PE ratio offers a snapshot of the current valuation, making it useful for quick comparisons and initial assessments. The PEG ratio, on the other hand, provides a more comprehensive view by incorporating growth expectations, making it crucial for evaluating long-term investment potential.
However, it is important to note that the PE and PEG ratios should not be used in isolation and should be considered alongside other valuation metrics and fundamental analysis for a well-rounded evaluation.
See you next time.
Until then… Stay Prudent!
Disclaimer: This article is provided for informational purposes only and should not be considered as an investment advice
Also read:

Nicely written. Very easy to understand